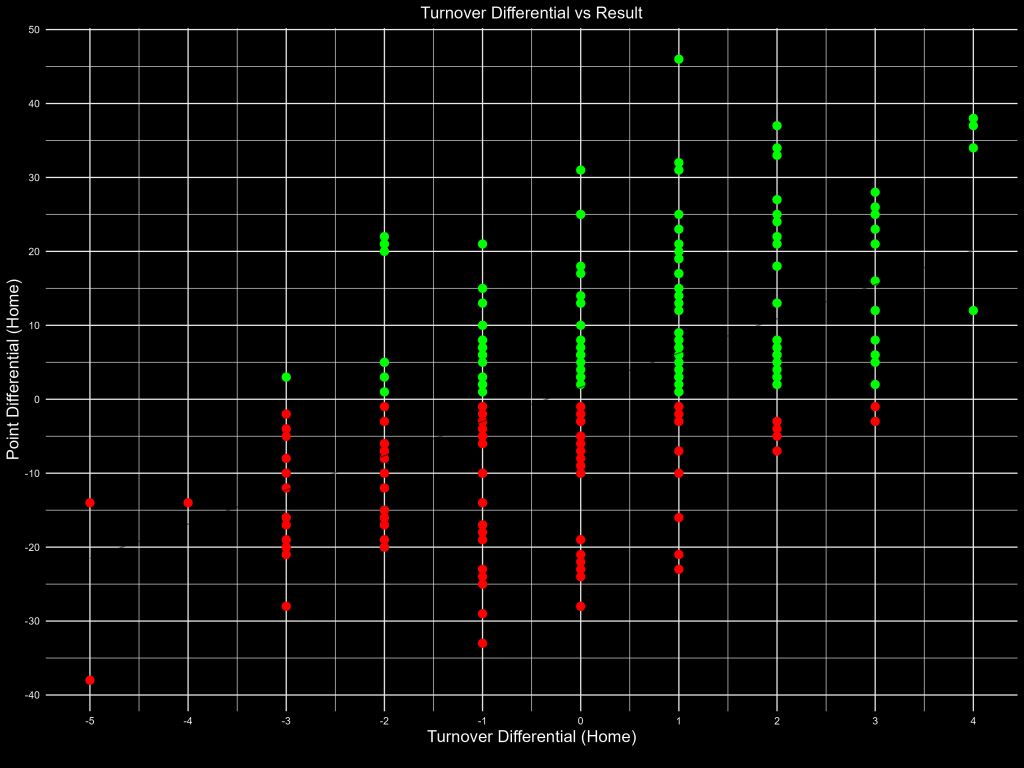
Turnovers decide games. In the ’24-’25 season’s playoffs, that’s more clear than ever before. Here is every game from the season, sorted by turnover differential and resulting point differential from the home team’s perspective. A positive point differential is a win, and a negative is a loss. You can see the unsurprising pattern. But what if we want to know exactly how impactful turnover differential is on your win percentage? First, we’ll need more data. (To be clear, we are looking at fumbles and interceptions. Turnover on downs is generally a more calculated risk and should be viewed separately)
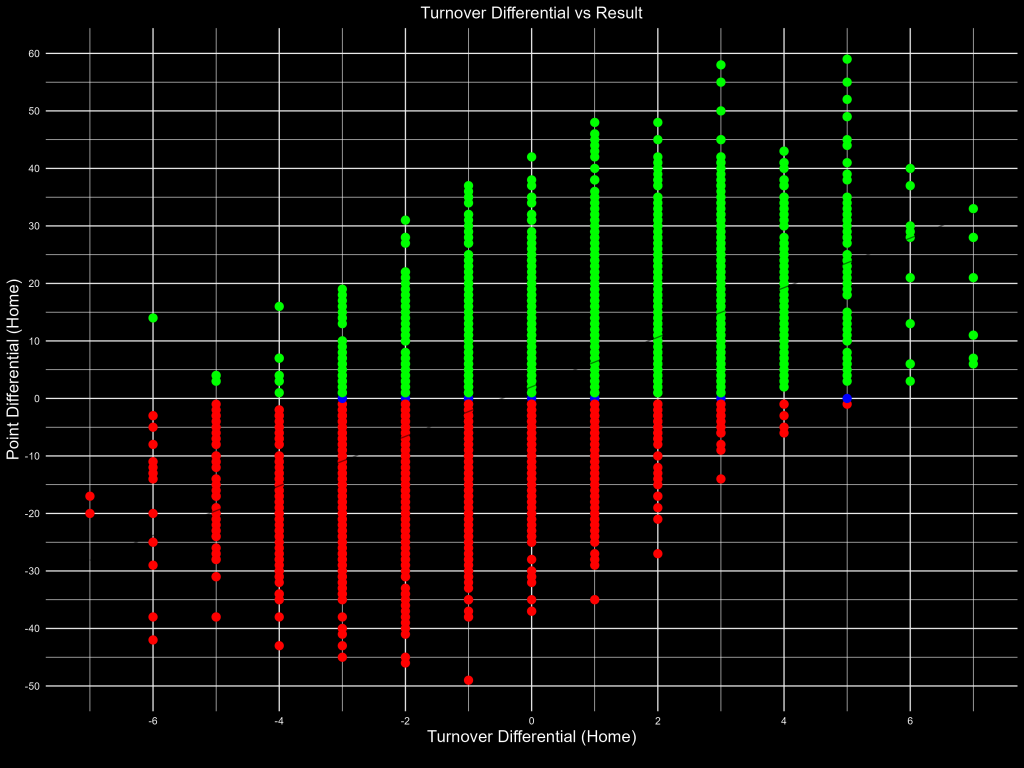
Below is the same chart, but using data from every game from 1999-2024. The chart looks prettier, but we still don’t have an easy way to get win percentage. To do this, we will need to change from our current home team perspective, and look neutrally. What is the chance of a win or a loss at a given turnover differential? (Keep scrolling)
The below chart shows us what we want to see. At each turnover differential margin, this shows the odds of winning that game. While there are diminishing returns as we get more turnovers, the impact is still clear. If you want to know the odds of the team with the negative turnover margin winning, just look at the red part.

This analysis isn’t groundbreaking by any means, but those win percentage changes are massive. The first two turnovers that you get, if not reciprocated by the opponent, add 17% and 15% respectively to your chance of winning, immediately. This also shows the value of conservative play once your opponent turns the ball over. Let them make the mistakes, and don’t move back to the left on the chart.